Verification
Every number on this page was produced by running the package, not by
inspecting it. The scripts are in verify/, and every figure below traces to a
single run of verify/run_delineation.py against basinkit 0.1.0 on
26 August 2026, not to a mixture of runs.
Prepared by Pradeepika Kaushik.
Delineation against published gauge areas
Two checks live here, and they answer different questions.
The twelve-gauge check below is a demonstration on named rivers. Those twelve were selected because their areas are published, which concentrates the sample in large, well-mapped basins, so its median error of 0.74% describes that class of river rather than the tool's range. It is kept because the three basins that diverge are instructive about what a published area includes.
The blind check further down is the validation the package's claims rest on: 2,740 delineations at 2,550 gauges in 99 countries, drawn by seed before any result was seen.
The twelve named rivers
The published areas come from operating agencies and GRDC station records, not from HydroBASINS, so agreement is an external check rather than a tautology.
| basin | basinkit | published | error |
|---|---|---|---|
| Danube @ Bratislava | 131,449 | 131,300 | 0.11% |
| Amazon @ Obidos | 4,671,504 | 4,680,000 | 0.18% |
| Godavari @ Polavaram | 306,750 | 307,800 | 0.34% |
| Mississippi @ Vicksburg | 2,979,823 | 2,964,000 | 0.53% |
| Rhine @ Lobith | 159,776 | 160,800 | 0.64% |
| Sapta Koshi @ Chatara | 54,497 | 54,100 | 0.73% |
| Mekong @ Pakse | 549,061 | 545,000 | 0.75% |
| Columbia @ The Dalles | 619,618 | 613,800 | 0.95% |
| Zambezi @ Victoria Falls | 519,436 | 507,000 | 2.45% |
| Parana @ Corrientes | 2,127,355 | 1,950,000 | 9.10% |
| Niger @ Lokoja | 1,747,192 | 2,074,000 | 15.76% |
| Murray @ Wentworth | 541,385 | 950,000 | 43.01% |
The distribution, not the best basin
n = 12. Median error 0.74%. Eight of twelve within 1%, nine within 3%. Excluding the three basins whose published figure includes large non-contributing area (below), n = 9, median 0.64%, worst 2.45%.
Twelve is a small sample and these are large, well-mapped rivers; the gauges were chosen because their areas are published, which biases toward basins that have been studied. Quoting a single basin would make the package look four times more accurate than it is; the Koshi alone reads 0.73%, and the best of the twelve reads 0.11%. Neither is the number.
The Amazon result is still worth pausing on: 4.67 million km² across 35,625 sub-basins, delineated in 43 seconds, 0.18% from the published figure. That is what graph traversal buys over raster fill.
The Murray is not a failure
A 43% shortfall looks like a bug until you look at the water balance:
delineated area          541,385 km²
nominal published area   950,000 km²
mean annual rainfall         434 mm
mean annual runoff          27.5 mm
runoff coefficient           0.063
A runoff coefficient of 6% over half a million square kilometres is the signature of a basin most of which does not drain to its own outlet. The Murray-Darling has vast internally-draining western areas; the 950,000 km² figure is the nominal basin, while HydroBASINS routes only what actually reaches Wentworth. basinkit's answer is the hydrologically contributing area, and for most modelling purposes that is the number you want. The divergence is worth knowing about, not worth hiding.
The Niger and Paraná gaps have the same character on a smaller scale: both have large arid or wetland zones whose contribution is intermittent.
The blind check
The twelve above were picked. These were not.
Source. The Global Streamflow Indices and Metadata archive (Do et al. 2018, Earth Syst. Sci. Data 10, 765-785): 30,959 gauges whose catchment areas come from the agencies that operate them. 18,785 carry an agency area, sit inside HydroSHEDS coverage, and are absent from GSIM's own list of distrusted coordinates.
Method. Four samples, four seeds, drawn before anything was run. Every station attempted is recorded, failures included. GSIM ships two coordinates per station: the agency's original, and one its authors moved so that the delineated area would match the reported area. 16,412 of 18,785 were moved that way. All of this uses the original, so no reported area ever entered a delineation.
One trap, found before the first run: GSIM_metadata.csv reports area in square
miles for its 2,395 USGS stations and square kilometres for everyone else.
Taking that column at face value manufactures a 61% error across North America
and nowhere else. The figures here use area.meta, which is km2 throughout.
By catchment size
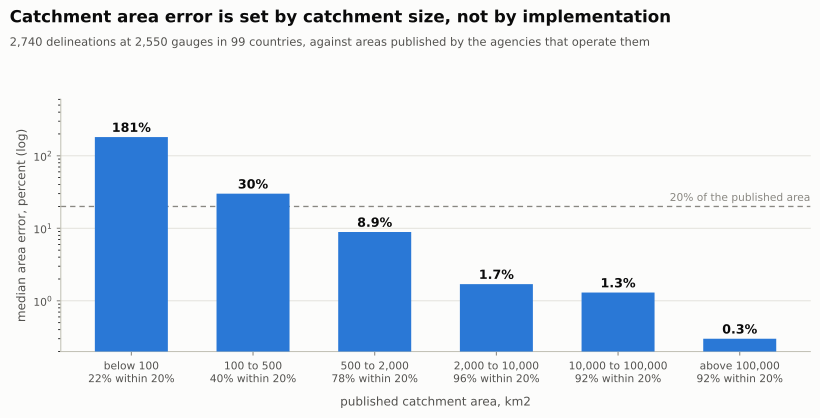
| catchment area | median error | within 20% | out by >100% |
|---|---|---|---|
| above 100,000 km2 | 0.3% | 92% | 0% |
| 10,000 to 100,000 | 1.3% | 92% | 0% |
| 2,000 to 10,000 | 1.7% | 96% | 0% |
| 500 to 2,000 | 8.9% | 78% | 4% |
| 100 to 500 | 30% | 40% | 16% |
| below 100 | 181% | 22% | 58% |
Weighted to the catalogue's own size mix: 61.9% within 20%, 16.7% out by more than 100%.
Since 0.9.3 the software states this row itself rather than leaving it on this
page. Basin.validation_envelope() reports which band a basin falls in, the
error measured there, and whether the headline figures describe it at all: a
135 km2 catchment is told that the median error measured at its size is 30%,
which is what the table has always said and what the output never did. Given a
dem_suitability() result it also compares the five terrain descriptors
against the range they covered in the 133 gauges where both were recorded, and
it names aridity, flow regulation and karst as conditions the validation did
not characterise, so that no number here is quoted about a case it was not
measured on.
By continent
Equal effort per continent and size band, because the catalogue is 72% European and North American and sampling it in proportion measures the North Atlantic and calls the result global. Pooled per continent, between 59 and 68% of answers land within 20%, from Africa to South America. Comparing catchments under 500 km2 against those over 10,000 within each continent separately, the median error is larger by 53x in Asia, 62x in North America, 65x in Africa, 102x in Europe and 217x in South America. Not one continent escapes it.
Two of 1,240 could not be attempted: gauges in French Polynesia, where the HydroSHEDS regional files stop at longitude 180 degrees. The tool raised a clear error naming the cause rather than returning a polygon.
Whose mistake it is
Every HydroBASINS unit carries UP_AREA, the dataset's own figure for
everything draining through it. The traversal reproduces that to within 1% on
95.3% of stations, and on 96.2% of the stations whose answer is wrong by more
than a fifth. The walk is right; the outlet unit is wrong. A level-12 unit has a
median area near 130 km2, so a point on a creek draining 0.8 km2 still lands
inside some unit whose outlet is on the trunk river, and the trunk's whole basin
comes back.
Scored by overlap rather than area, on 360 stations against GSIM's own catchment boundaries: median IoU is 0.10 below 100 km2 and 0.99 above 10,000. Spearman correlation between area error and overlap is -0.847, and of 230 answers within 20% on area, none had an overlap below 0.5, so the area metric is not hiding a right-size-wrong-place failure here. GSIM's own boundaries differ from the agency areas by 2.0% at the median, which is the reference's own floor.
Against other implementations
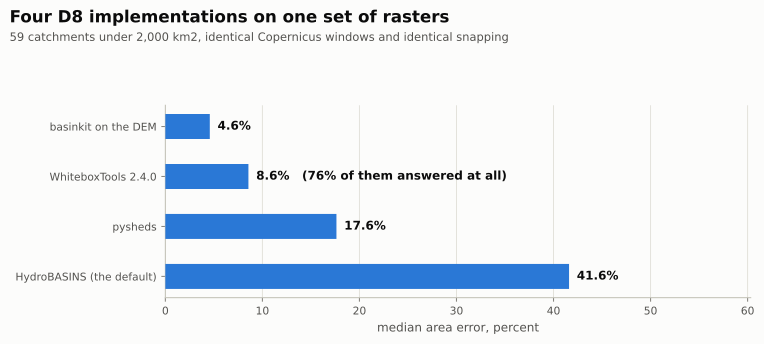
59 catchments under 2,000 km2, one Copernicus 30 m window per station, three D8 implementations on the identical raster:
| method | answered | median error | within 20% |
|---|---|---|---|
| HydroBASINS (default) | 100% | 41.6% | 34% |
| basinkit on the DEM | 100% | 4.6% | 68% |
| pysheds | 100% | 17.6% | 56% |
| WhiteboxTools 2.4.0 | 76% | 8.6% | 51% |
Where all three return a basin they agree to within 5% on 73% of stations, which locates the small-catchment limit in the resolution of pre-computed sub-basins rather than in any one implementation.
Two harness settings were corrected before scoring, since both would have
understated a baseline: pysheds' catchment defaults to snap='corner', which
returns a single cell, and rioxarray writes the DEM with nodata 0, which leaves
interior pits and reduces WhiteboxTools' flow accumulation from 8.5 million
cells to 9,248.
25% of these stations sit outside what any of the four reproduces, at both snapping distances tried. That is the ceiling this catalogue supports, rather than a property of the tools.
The twelve-metre backend, on 360 gauges
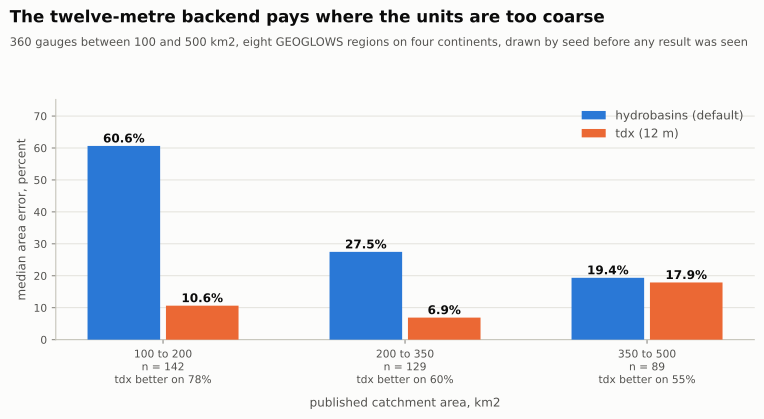
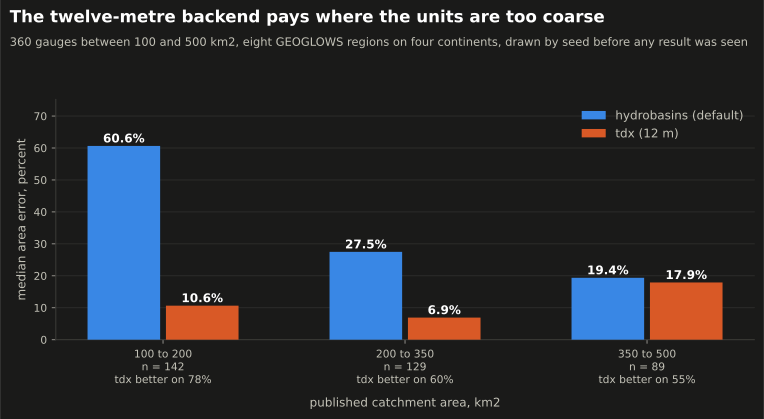
The first measurement of backend="tdx" was 60 gauges in two regions. Widened
to 360 between 100 and 500 km2 across eight GEOGLOWS regions on four
continents, drawn by seed before any result was seen:
| backend | median error | within 20% | better on |
|---|---|---|---|
hydrobasins |
32.5% | 38% | 34% |
tdx |
10.5% | 58% | 66% |
Broken down by size, the gain behaves exactly as the mechanism predicts:
| catchment size | n | hydrobasins |
tdx |
tdx better |
|---|---|---|---|---|
| 100-200 km2 | 142 | 60.6% | 10.6% | 78% |
| 200-350 km2 | 129 | 27.5% | 6.9% | 60% |
| 350-500 km2 | 89 | 19.4% | 17.9% | 55% |
The advantage is largest where a catchment is a fraction of a level-12 unit and closes as the catchment grows past one. That is the claim, and it is the shape the measurement has.
Two qualifications that belong with the headline. It is the better answer in
seven of the eight regions and not in the eighth, region 706, where the default
is better at the median. And the two backends fail in opposite directions: the
default's median signed error is +31% and its quartiles are +7% to +87%, so it
returns too much; tdx sits at -1% but its lower quartile is -67%, so it
occasionally snaps to a tributary and returns far too little. A tdx answer
that looks small should be checked against provenance["snap_km"].
Does the suitability grade mean anything?
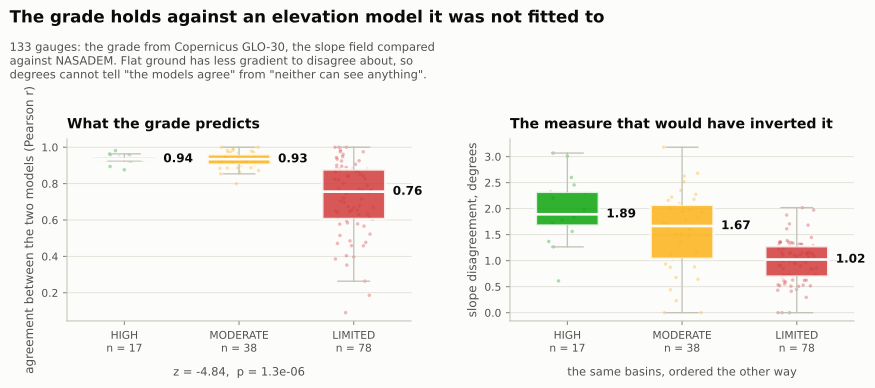
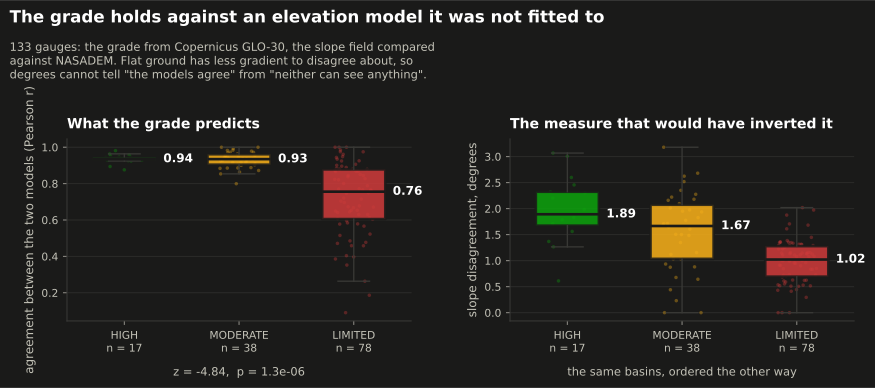
A grade is worth nothing until it predicts something it was not fitted to. The test: compute the grade from Copernicus GLO-30, then ask a second, independently produced elevation model to describe the same ground. NASADEM comes from the Shuttle Radar Topography Mission of February 2000, separately reprocessed; Copernicus comes from TanDEM-X flown 2011-2015. Different sensors, different decades, different processing chains, so their disagreement is not a shared artefact. Where a basin's terrain is above what either can resolve, the two slope fields should describe the same hillsides. Where it is below, both are returning their own noise.
160 gauges drawn by seed from the blind validation set before any result was seen; 133 carried both models. The measure is the correlation between the two slope fields:
| grade | n | median Pearson r | p25 | p75 |
|---|---|---|---|---|
| HIGH | 17 | 0.935 | 0.928 | 0.949 |
| MODERATE | 38 | 0.934 | 0.903 | 0.965 |
| LIMITED | 78 | 0.756 | 0.602 | 0.878 |
HIGH against LIMITED, Mann-Whitney: z = -4.84, p = 1.3e-06. The grade predicts whether two independent elevation models agree about the terrain, which is what it claims to be about.
Each test carries its own weight in the same direction. Where the slope test is unmet, median r is 0.748 against 0.935 elsewhere; where the filling test is unmet, 0.671 against 0.898; the two basins where the relief test is unmet sit at 0.415.
The measure had to be a correlation, not a difference. Disagreement in degrees runs the other way: HIGH basins differ by 1.89 degrees at the median and LIMITED basins by 1.02. That is not the models agreeing on flat ground, it is flat ground having less gradient to disagree about. A measure of resolvability that rewards a basin for being flat is measuring the wrong thing, and any absolute threshold on slope disagreement would have inverted this result.
The grade does not predict catchment area error, and must not be read that way. On the same sample the HIGH basins have a median area error of 73% and the LIMITED basins 9%. That is a size confound, not a finding: the HIGH basins here have a median area of 397 km2 and the LIMITED ones 1,207 km2, and area error is governed by catchment size. This is the separation the grade's own documentation states, holding up under test: it describes the terrain products computed from the raster, and the accuracy of the boundary is a different question measured elsewhere on this page.
One number worth sitting with: 78 of 133 gauged catchments graded LIMITED. On a 30 m global elevation model, most gauged catchments are not well enough resolved for the terrain products usually computed over them, and until now nothing said so.
27 of the 160 dropped out, 24 because the benchmark's own cache eviction removed a tile mid-run and 3 on a read error. The eviction fired on a timer under disk pressure, so the loss is unrelated to any property of the basins.
Reservoir bridging: measured, then rejected
D8 flow direction is undefined on a level surface, so a reservoir can fragment the flow network and leave a catchment delineated from below a dam far too small. The standard fix is to detect standing water by its smoothness and impose a slight fall across it before routing, carving a channel to the outlet when one is known. It was implemented here and tested on six catchments, four of them the worst failures in the sample:
| catchment | published | error without bridging | error with bridging |
|---|---|---|---|
| Koyna Dam, India | 891.8 km2 | +1.3% | +1.3% |
| Katse Dam, Lesotho | 1867.0 km2 | +0.2% | +0.2% |
| PL_0000048, Poland | 276.0 km2 | +101.6% | +100.9% |
| SE_0000025, Sweden | 202.7 km2 | +172.8% | +172.8% |
| CA_0003306, Manitoba | 278.0 km2 | +54.5% | -98.0% |
| US_0001851, Florida | 303.0 km2 | +99.2% | -94.5% |
Nothing improved, two answers were destroyed, and the runtime on Koyna went from 27 to 92 seconds. The two failures are the same failure: on a window sized automatically rather than drawn by hand, the smoothness test finds the sea. It reported a single 2,368 km2 water body near Koyna and a 2,196 km2 one in Florida, then imposed a drainage gradient across each.
The deeper reason it had nothing to fix is in the sample itself. Across the 88 stations between 100 and 2,000 km2, the DEM backend returns no under-estimates at all -- every error is an over-estimate. Fragmentation by standing water produces the opposite signature, a basin truncated above the lake. The mechanism does work where the geometry calls for it: on a synthetic reservoir whose dam stands above a lower saddle on its own rim, depression filling spills the wrong way and bridging recovers the catchment. That geometry did not appear in any real catchment tested, and where the answer was already right the correction had nothing to add.
A more conservative detector, restricted to water inside a first-pass basin, would avoid the damage. It would not buy anything, because there is no measured gain for it to protect. The feature was removed rather than shipped switched off.
What the checks in 0.5.0 are worth
The river-network check fires when the basin exceeds twice the area draining to the largest river within 2 km of the outlet: 85% precision, 3.2% false alarms, 30% recall, with precision from 75% in Europe to 93% in Africa.
The corrective re-delineation, tested on 300 gauges drawn after all of it was designed and used nowhere else: 19 corrected, 279 unchanged, 0 made worse, with the median error where it acted falling from 1,731% to 4.3%.
Outlets that are not on rivers
Every gauge sits on a river by construction, so a gauge sample does not cover a click on a city, a lake surface or a desert. Those are tested separately, and they set the distance gate on the refinement step:
| outlet | sub-basin route | refinement ungated | 0.5.0 as shipped | published |
|---|---|---|---|---|
| central Delhi | 36,944 | 18 | 36,944 + warning | about 9,700 |
| Lake Victoria surface | 195 | 195 | 195 + warning | about 184,000 |
| Lake Baikal surface | 786 | 786 | 786 + warning | about 560,000 |
| Sahara interior | 145 | 145 | 145 + warning | endorheic |
| Svalbard | 115 | 18 | 115 + warning | small, plausible |
The switch is now gated on the distance to the river it would judge by. All 25 corrective switches that were right had theirs within 0.91 km, median 0.15 km; all five of these had theirs beyond 1.3 km. The gate costs one correction in 300 and prevents all five.
None of those outlets has a resolvable catchment at this grid: a lake surface and a closed depression have no upstream network to assemble. The package now identifies each situation by name, reports it, and leaves the more conservative of the two available answers in place.
Clicks that are refused outright, with the reason named: open ocean, Antarctica, a coordinate a few hundred metres offshore, and latitude and longitude swapped.
An earlier version searched 1 km instead of 2 and rewrote two correct continental answers, including a Mekong gauge whose 373,000 km2 became 9.5 because the only mapped reach within a kilometre drained 5.9 km2. That is why the radius is 2 km.
The second reference, and what it is not
The outlet check above is the better instrument and it needs HydroRIVERS,
which is a separate regional download of a few hundred megabytes. basinkit
will not start one behind a request for a basin, so where the network is not
already cached the check reports not-cached and nothing is weighed. That gap
was where three findings lived: api returning 1.9 km2 of the Danube, tdx
returning 73 km2 of the Thames, and both reported as ordinary answers.
check_magnitude fills it with the only reference that costs nothing:
HydroBASINS' own UP_AREA, the upstream area the dataset publishes for each
unit's outlet. It is on disk already for anyone who has used the default
backend. It is also coarse -- the figure belongs to the unit's outlet rather
than to the clicked point, so for a point part-way up a unit it overstates by
up to that unit's own area, about 130 km2 at level 12 -- and it is read from
the same family of data as one of the four backends, so it is not independent
of that one.
Two things follow, and both are deliberate. The threshold is a factor of ten, which is not tuned and is not meant to be: four backends read four grids, two of them a quarter of a century apart, so disagreements of tens of percent are ordinary and say nothing, while a factor of ten is not a disagreement about resolution. And a basin outside the band is reported, never replaced -- there is no measured precision behind this check, only the reasoning above, and acting on a signal of unknown precision would be the same mistake it exists to catch. The two failures it was written for cleared the threshold by three and by two orders of magnitude respectively.
Prior art
The finding that automatic delineation fails on small catchments is not new and is not claimed as new. Kauffeldt et al. (2013, HESS 17, 2845-2857) plotted area error against basin size for 7,518 GRDC gauges. Lehner (2012, GRDC Report 41) wrote it plainly: small watersheds are found close to any location, including incorrect ones. Godet et al. (2024), Johnston et al. (2009) and Heberger (2025) all stratify by size. Caravan encodes it as a 100 km2 floor, HYSETS replaces catchments under 50 km2 with bounding boxes, MERIT-Basins stops at 25 km2.
What differs here is narrow: the large-sample studies feed the reported area into the outlet-snapping objective and then score against that same reported area. This does not.
Limits
- Australasia contributes 43 scorable stations in the whole archive and none above 100,000 km2, so that row is indicative rather than measured.
- Remote Pacific islands are outside HydroSHEDS altogether.
- One threshold was validated on unseen data. The design around it was not.
- The baseline is two implementations, not five, and all three compared route D8 on the same Copernicus grid.
- Agency areas can be stale or refer to a different structure, and GSIM's boundaries come from the same HydroSHEDS grid, so the overlap metric measures agreement with the accepted delineation rather than with the ground.
MERIT-Hydro: not a check, a migration path
This was presented as independent confirmation. It is better read as the opposite.
| backend | base grid | source | Koshi |
|---|---|---|---|
hydrobasins (default) |
15 arc-sec, ~460 m | SRTM, February 2000 | 54,497 km² |
api |
3 arc-sec, ~90 m | MERIT-Hydro, error-removed | 54,045 km² |
dem |
1 arc-sec, ~30 m | Copernicus, 2011-2015 | - |
The two agree to 0.8% with different source DEMs, different algorithms and no shared code, which is real evidence that neither is badly wrong. But agreement is not the interesting fact here. The default backend routes on a quarter-century-old 460 m grid. MERIT-Hydro is five times finer and hydrologically conditioned. A South Asian toolkit that runs at 90 m is a reason to exist; one that agrees with the 450 m product is a validation exercise.
The obstacle is not technical: the 90 m path is already implemented as the
api backend. It is licensing: MERIT-Hydro is CC BY-NC 4.0 or ODbL, acquisition
cannot be automated, and the current route depends on one research group's
server. Making 90 m the default means solving distribution, not routing.
Rainfall against published climatology
Sapta Koshi basin, 2010-2019:
| product | basin mean | published range |
|---|---|---|
| CHIRPS v3.0 | 1,335 mm/yr | 1,200-1,500 mm/yr |
| TerraClimate | 1,002 mm/yr | - |
CHIRPS lands inside the published band. TerraClimate reads 25% lower, which is a known characteristic rather than a defect: it is downscaled from coarse reanalysis and systematically under-resolves orographic enhancement in high mountains. For a Himalayan or Andean basin, prefer CHIRPS. TerraClimate's value is its water balance terms, not its rainfall.
Optical imagery end to end
Rur basin at Jülich (1,555 km²), Sentinel-2 median composite, July-August 2023:
| quantity | value | expected |
|---|---|---|
| red reflectance (mean) | 0.047 | 0.03-0.08 for vegetated land |
| NIR reflectance (mean) | 0.290 | 0.25-0.40 |
| NDVI (median) | 0.82 | 0.6-0.85, temperate cropland and forest in July |
| finite fraction | 0.500 | bbox efficiency 0.509 |
Getting a correct NDVI requires the search, the nodata masking, the scale, the offset, the solar-day grouping, the composite and the polygon clip all to be right at once. It is the single most informative check in the suite.
Sentinel-1 RTC on the same basin returns a mean γ⁰ of −9.3 dB, within the published −15 to −5 dB range for vegetated land.
Clipping
The finite fraction of every clipped layer tracks bbox_efficiency to within a
couple of percent: Sentinel-2 0.500 against 0.509, Landsat 0.514, Sentinel-1
0.514, exported GeoTIFFs 0.602 against 0.601 on the Danube. That is the clip
doing exactly what it claims, measured rather than asserted.
The catalogue audit
Rating the package honestly meant auditing what it claims against what it does. Two things came out of that.
Eight of twenty-six catalogued datasets had no fetcher. The catalogue listed
them with resolution, licence and access route, and grace and hydroatlas
even showed auth=none, commercial=yes, so a reader would reasonably conclude
they could be downloaded. Fixed three ways: hydroatlas is now implemented,
grace was corrected to auth=account (the CSR anonymous mirror was
unreachable; the working route is JPL via Earthdata Login), and the remaining
six raise NotImplementedSource carrying the access route and licence.
>>> basinkit.catalog.require("glofas")
NotImplementedSource: GloFAS v4 (CEMS-Floods) is catalogued but basinkit
cannot fetch it yet.
    Access : CEMS Early Warning Data Store (ewds.climate.copernicus.eu/api)
    Licence: CEMS-Floods licence
    Auth   : account required
    Once you have it locally, pass the geometry to
    basinkit.clip.clip_raster() to cut it to the basin.
Seven public methods had never been executed. plot() was one of them, and
it crashed on NumPy 2.x: ndarray.ptp() was removed in NumPy 2.0 while
pyproject allows numpy>=1.24. explore() was another: leafmap simply was
not installed, so the interactive path had never run at all. Both now have
tests, and one of those tests scans the whole package for every NumPy-2-removed
API.
BasinATLAS as an independent check
Implementing BasinATLAS produced an unplanned validation. It ships its own mean elevation per basin, derived from a different DEM by a different group:
| quantity | BasinATLAS | basinkit (COP-DEM) |
|---|---|---|
| Koshi mean elevation | 3,782 m | 3,786 m |
0.1% apart. Its precipitation reads 851 mm/yr against CHIRPS's 1,335, the same orographic under-resolution seen in TerraClimate, and for the same reason: BasinATLAS's climate layers come from WorldClim, downscaled from coarse gridded data.
Defects this found
Verification is only worth doing if it changes the code. It changed twelve things, and every one is now a regression test.
| what | how it showed up |
|---|---|
| Outlet on a riverbank | Rhine at Lobith returned 271 km² instead of 160,800. The point sits in a 270 km² bank unit; the main stem is 200 m away. Godavari at Polavaram, same story, 454 m. HydroBASINS' own UP_AREA agreed with the tiny answer, so every internal check still passed. Fixed by snapping when a nearby unit drains ≥10× more, with a warning. |
| Sentinel-2 offset applied twice | Earth Search pre-applies the baseline-04.00 BOA offset and flags it, while still publishing the nominal −0.1. Applying it again gave a mean reflectance of −0.05 over a green catchment. |
| Nodata averaged into composites | Optical products encode "no observation" as 0. A basin straddles several MGRS tiles, so most scenes cover a fraction of it, and an unmasked Sentinel-2 median came back 87% zero. |
| Clip broken on every Dataset | Dataset has no .values array; reaching for one picks up a method. The clip worked on every single-band raster and failed on every multi-band STAC result. |
| Rasters exported without nodata | Correctly masked in memory, then written to GeoTIFF with no declared nodata, so QGIS paints the outside solid black and rasterio returns no mask. The clip silently stopped existing the moment the file left Python. |
| Nodata sentinel averaged in mosaics | JRC surface water uses 255 without declaring it, so an averaging resample produced occurrence values of 101%. |
outlets="min" in flow routing |
Routes a whole DEM window to its lowest cell. A river with 2,500 km² upstream came back with 0.2 km² at the same coordinate, purely because the window shifted. |
Basin.plot() broken on NumPy 2 |
ndarray.ptp() was removed in NumPy 2.0; pyproject allows numpy>=1.24. Found only by auditing which methods no test had ever called. |
| BasinATLAS extent code misread | Extent is the first letter of a column's third token (pre_mm_uyr upstream, run_mm_syr sub-catchment), not a trailing suffix. Read as a suffix it matched nothing and attributes() returned an empty dict. |
| BasinATLAS scaled integers | Stored as integers to keep the tables compact. Read raw, the Koshi averages 50 °C and a 204° slope. |
| The README's own example was wrong | Found on release day by running it. from_point(26.5, 85.2), advertised as "14,384 km²", sits 16 km off the Bagmati channel and returns 434 km². The delineation was correct and HydroBASINS' UP_AREA agreed with it to 0.2%; the coordinate was wrong and the printed figure had gone stale. The first code block a new user ran disagreed with its own output by a factor of thirty. Fixed by moving every documented example to the Chatara outlet the network suite verifies, adding an off-channel advisory warning, and pinning the documented coordinate to the tested one. |
| ESRI land cover returned the wrong year | Found while trying to build a year-by-year change animation. Every annual item ends at 00:00 on 1 January, so a naive year window matches the previous year's map at the boundary instant: asking for 2024 (the package default) returned the 2023 map. Nothing raised, and the array was entirely valid. Three more defects sat in the same code path: the WorldCover legend applied to ESRI codes (reporting cloud as forest), a Dataset returned where a DataArray was expected, and two tiles stacked on a time axis instead of mosaicked. |
Ten of the twelve produce answers that look entirely plausible: an empty dict, a negative reflectance, a 271 km² Rhine. Only two of the twelve raised an exception, and both were found by auditing which methods no test had ever called, not by the suite. That is the argument for checking against published values rather than snapshots: a snapshot test would have locked the other eight in as the expected answer.
Platform coverage
| offline suite | notes | |
|---|---|---|
| Python 3.10 | 31 passed, 2 skipped | skips are optional extras not in [dev] |
| Python 3.11 | 48 passed | full extras installed |
| Python 3.12 | 31 passed, 2 skipped | |
| Windows, macOS | not run | CI declares them; nobody has executed them |
Linux only so far. The CI matrix claims three operating systems and three Python versions; two of the three Pythons are now real, the two other operating systems are still a claim.
Reproducing this page
The benchmark samples behind the figures are in verify/benchmarks/, and the
scripts that produced and read them are in verify/:
python verify/run_tdx_wide.py            # the 360-gauge sample
python verify/run_grade_validation.py    # the 133-gauge grade test
python verify/analyse_tdx_wide.py        # the tables above, recomputed
python verify/analyse_grade_validation.py
python verify/make_figures.py            # every figure, light and dark
One table is not reproducible from this repository, and it is the biggest one.
The blind validation of 2,740 delineations is built on GSIM station records,
and shipping the identified set would be redistributing that dataset rather
than this package's own results. What is shipped is the result as the table
above reports it, in verify/benchmarks/accuracy_by_size.csv, which is what
the first figure is drawn from -- so the chart and the table cannot drift
apart, but neither can be recomputed here from scratch. The gauge list is
GSIM's, and anyone with it can repeat the run.